Lenga Maps
LENGA MAPS

Unmasking Africa with Data and Intelligence

Use cases

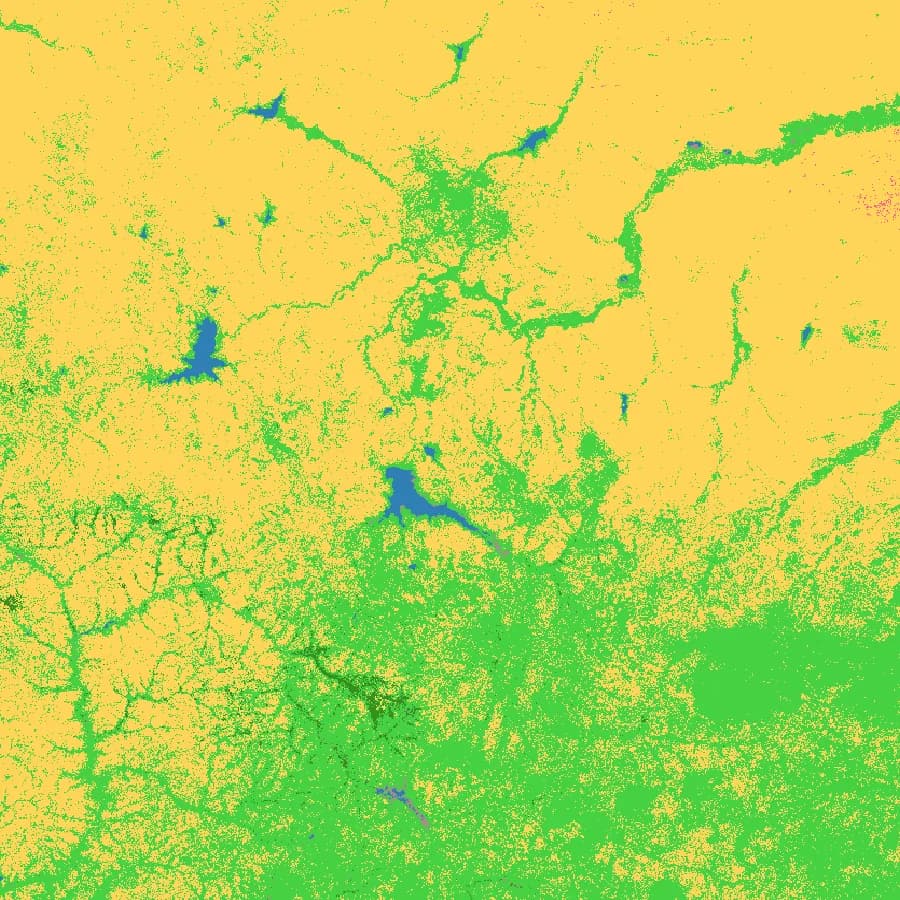
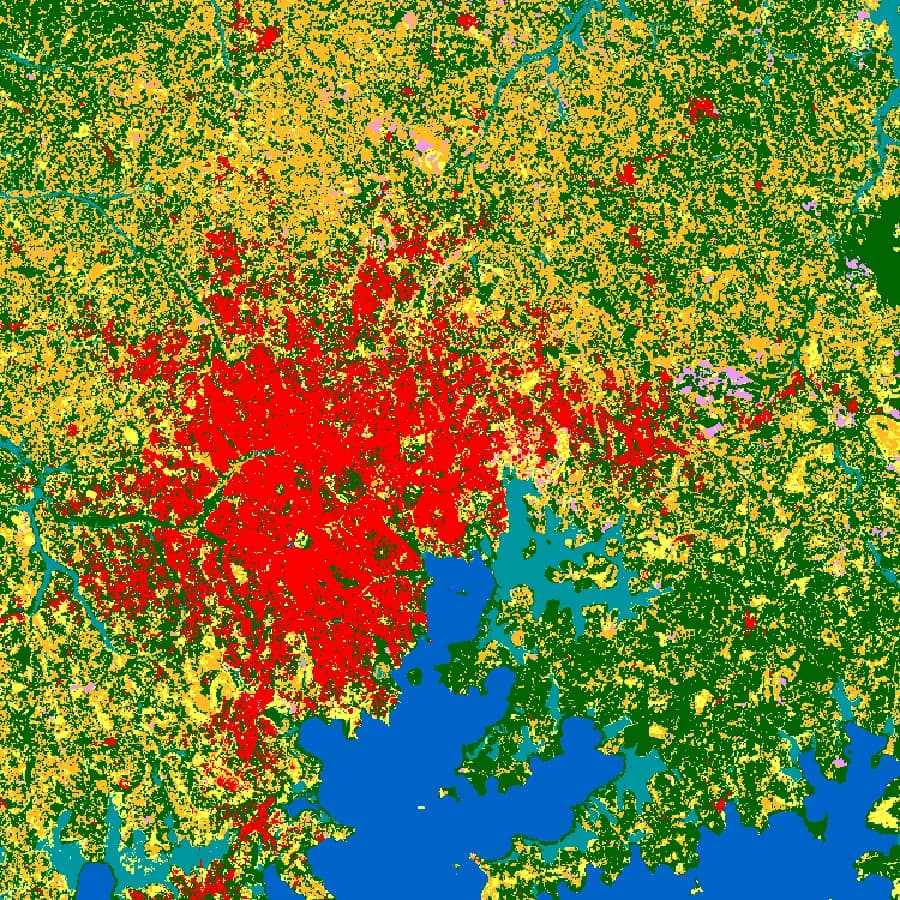
ESA WorldCover land cover
Environmental and social impact assessment

ESIA baseline and area of influence

Define the area of influence and assemble the physical, biological and social baseline from one consistent source, so every specialist starts from the same map.

  • Screen the site against protected areas and IFC PS6 sensitivities
  • Count settlements and people in the direct and indirect area of influence
  • Map receiving watercourses, soils and land cover for the baseline chapter
Open the ready-made map
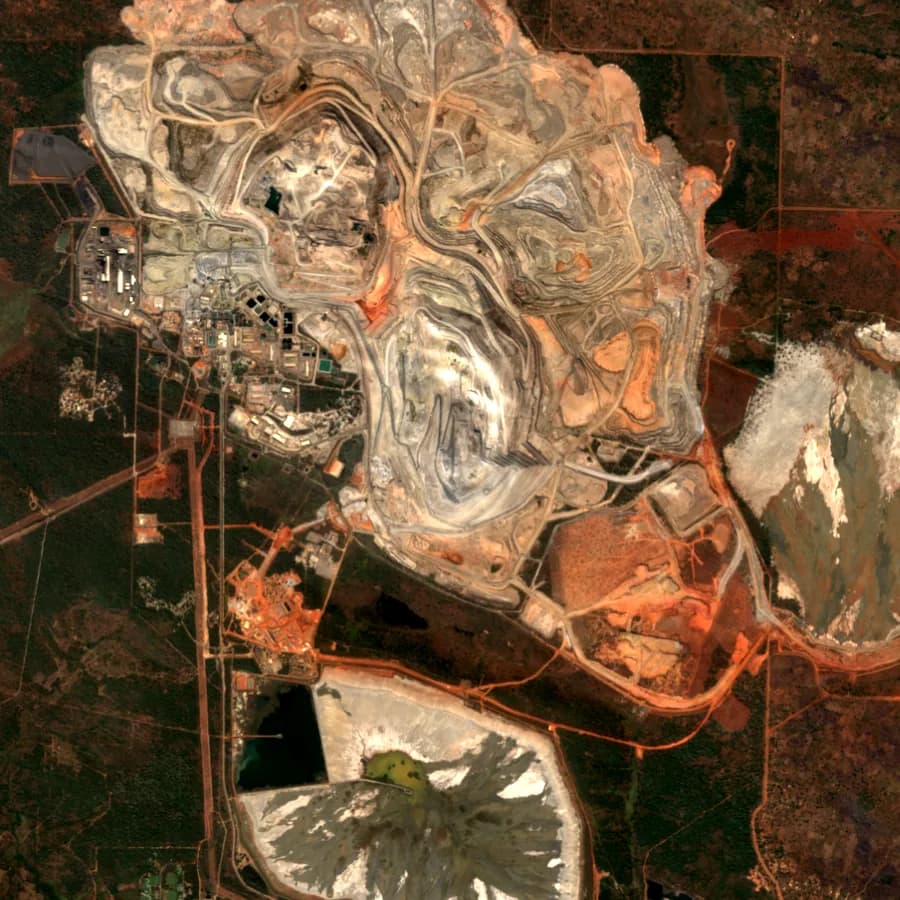
Sentinel-2, open pit mine
Mining and ESG reporting

Receptors around a mining licence

Know what lies downstream of and around the licence before permitting, lender due diligence or an ESG disclosure asks for it.

  • Trace drainage from pit and plant to downstream users
  • Quantify communities and land use within set buffers of the licence
  • Support IFRS S2 physical risk disclosure with rainfall, heat and drought history
Open the ready-made map
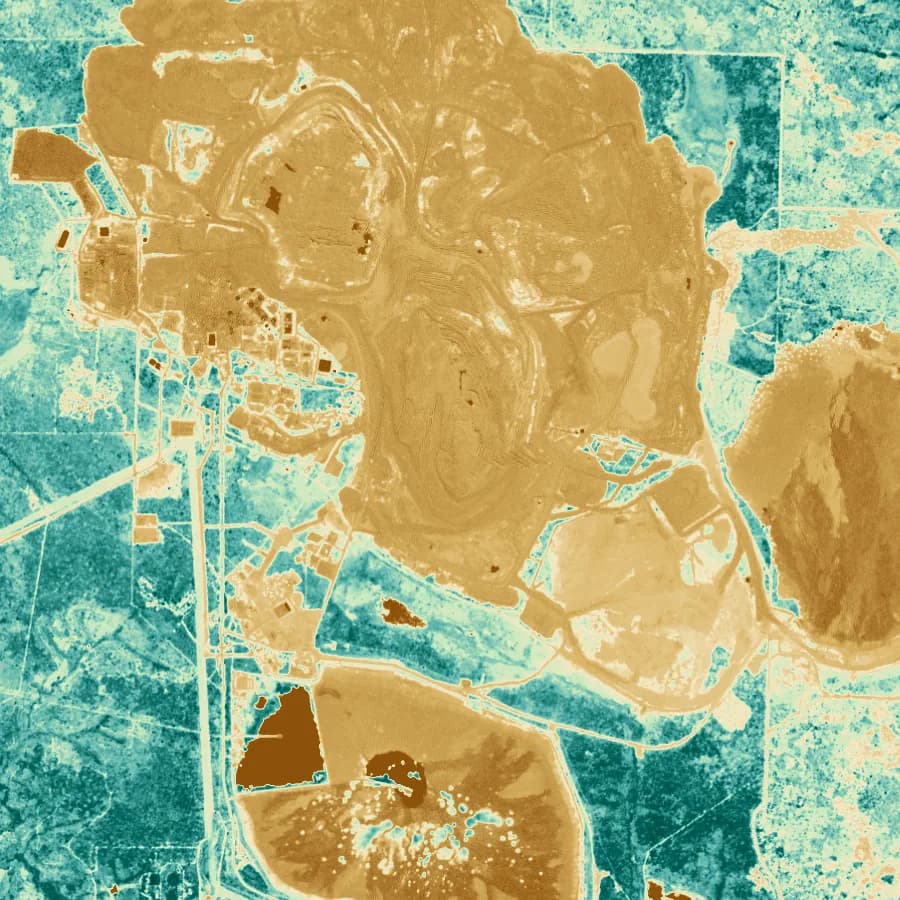
NDVI over a mine and its surroundings
Tailings and mine closure

Tailings consequence and closure evidence

Tailings classification depends on who and what lies downstream. Closure depends on proving rehabilitation over years, not at one inspection.

  • Map people, infrastructure and ecosystems in a potential breach path for GISTM classification
  • Track revegetation with NDVI against the land cover baseline
  • Keep each season of closure monitoring in one project history
Open the workspace
Sentinel-2, forest and cleared land
REDD+ and avoided deforestation

REDD+ project design and monitoring

Under VM0048 the jurisdictional risk map comes from Verra. The project still draws its own boundaries, documents the drivers and shows its safeguards, and that is spatial work.

  • Delineate the project area and leakage belt against land cover, roads and settlements
  • Document the drivers of deforestation near the boundary for the project description
  • Screen drought and fire exposure for the AFOLU non-permanence risk assessment
Open the workspace
iSDAsoil soil classes
Afforestation and restoration carbon

ARR land eligibility and species suitability

Before a hectare is planted, an ARR project has to show the land was not forest in the years before the start date and that the trees will survive the local climate.

  • Check land cover history to support land eligibility
  • Match species to soils, rainfall and temperature by planting block
  • Estimate drought risk to survival rates and the buffer contribution
Open the workspace
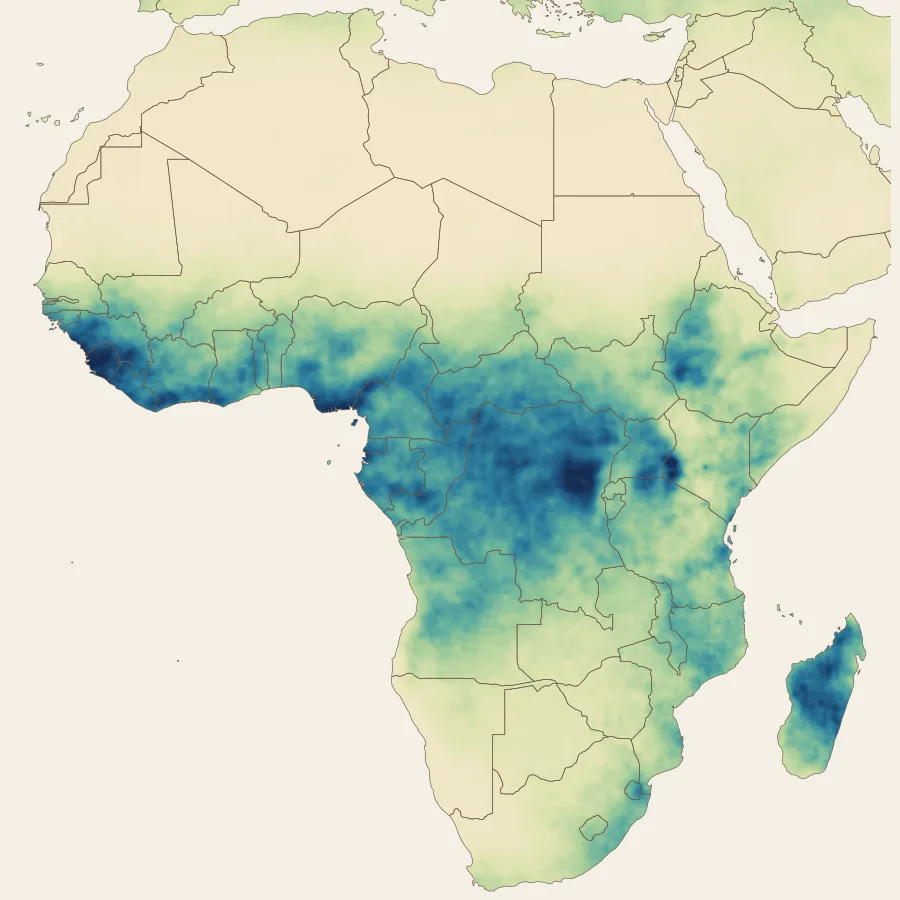
CHIRPS mean annual rainfall, Africa
Climate finance proposals

Climate rationale for GCF and Adaptation Fund proposals

Funders want evidence that climate is driving the problem the project solves. The observed record and the exposure behind it belong in the proposal, not in a promise for inception.

  • Show observed rainfall, temperature and drought trends for the target districts
  • Quantify the people and cropland exposed to the hazard addressed
  • Produce the maps for the concept note, feasibility study and results framework
Open the workspace
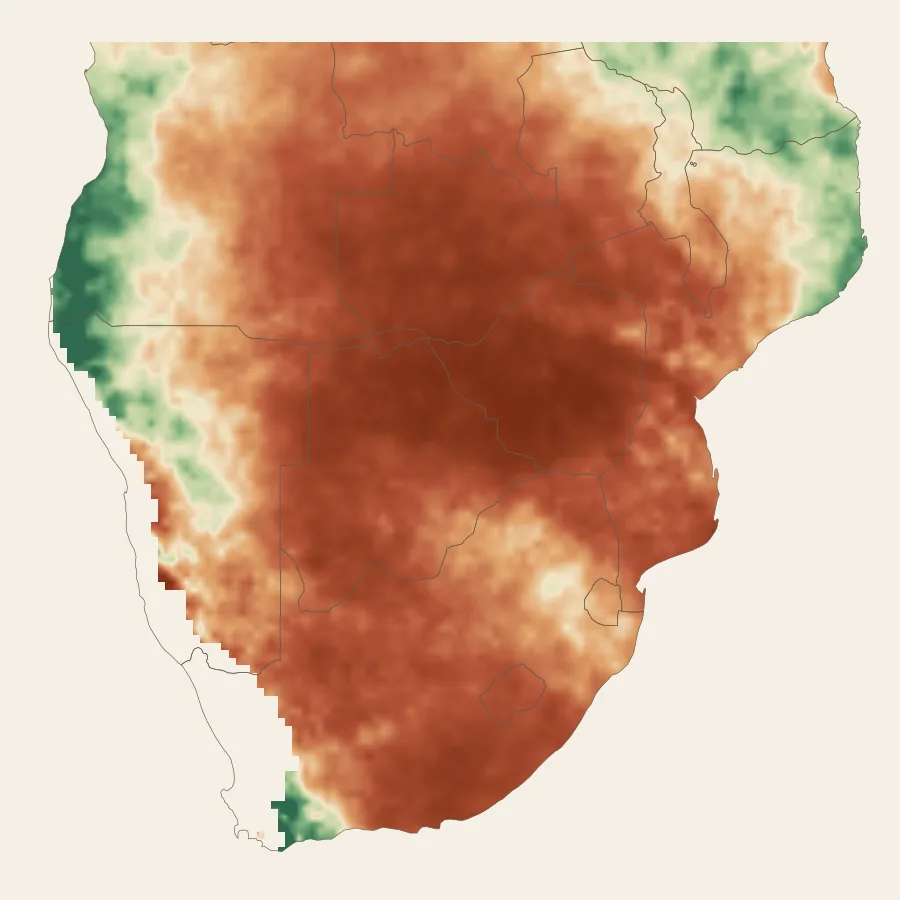
SPI 12 drought index, southern Africa
El Niño and drought response

El Niño drought exposure and early action

The 2023/24 El Niño cut harvests across southern Africa and took Kariba close to its minimum operating level. Response and investment plans need the exposure mapped before the next event.

  • Rank districts by SPI 12 history, rainfall deficit and population
  • Set and test drought triggers for anticipatory action and contingency plans
  • Compare past El Niño seasons with the long term record for one area
Open the workspace
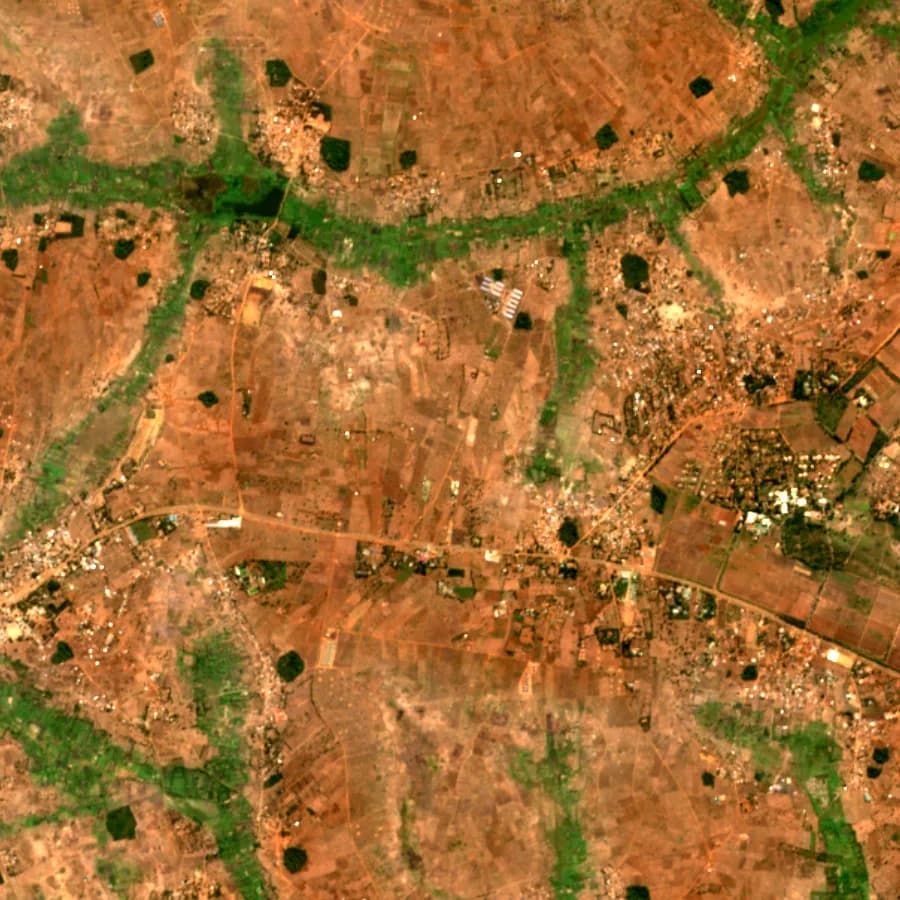
Sentinel-2, smallholder farmland
Agriculture and food security

Production risk for programmes and offtake

Input, extension and offtake plans all assume a normal season. Drought history, soils and rainfall by district show where that assumption fails most often.

  • Target input and extension programmes to suitable soils and reliable rainfall
  • Identify districts with repeated drought for food security planning
  • Give spatial context to crop assessments and IPC analysis
Open the ready-made map
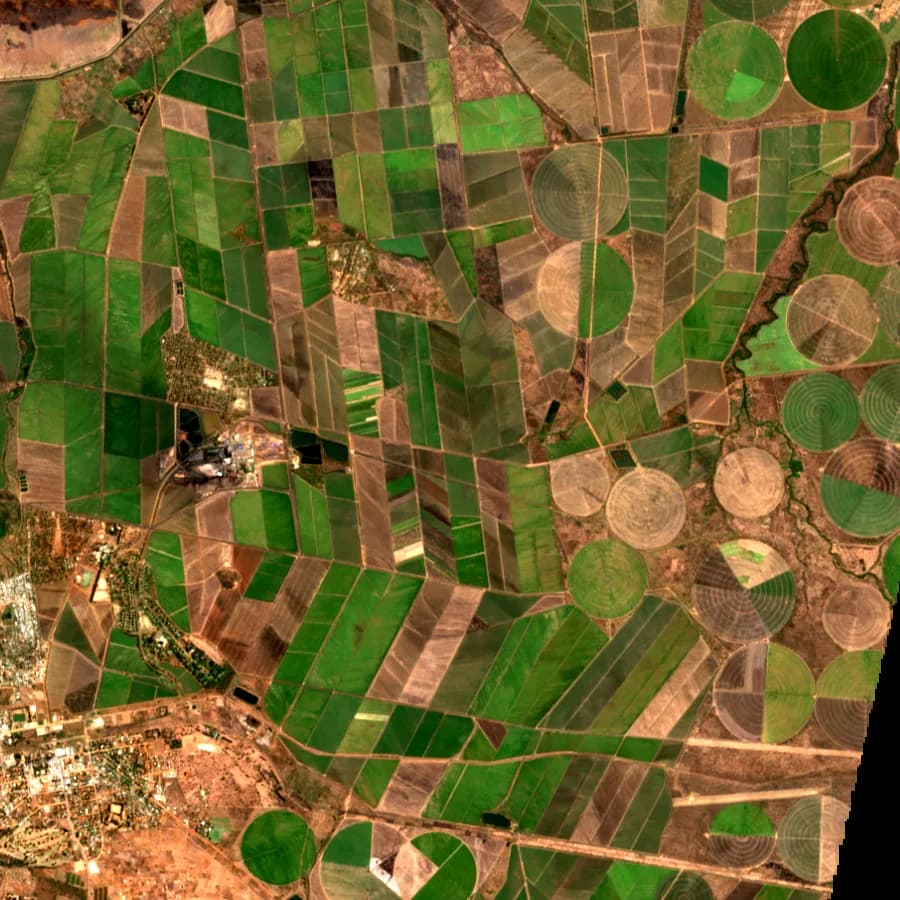
Sentinel-2, irrigated estates and outgrowers
Agricultural lending and insurance

Drought exposure across a loan or insurance book

Lenders and insurers carry weather risk they rarely see on a map. Placing the portfolio on the drought and rainfall record shows where it is concentrated.

  • Map borrower or policy locations against SPI 12 drought history
  • Support index insurance design with long rainfall records by area
  • Report climate exposure to investors and regulators
Open the workspace
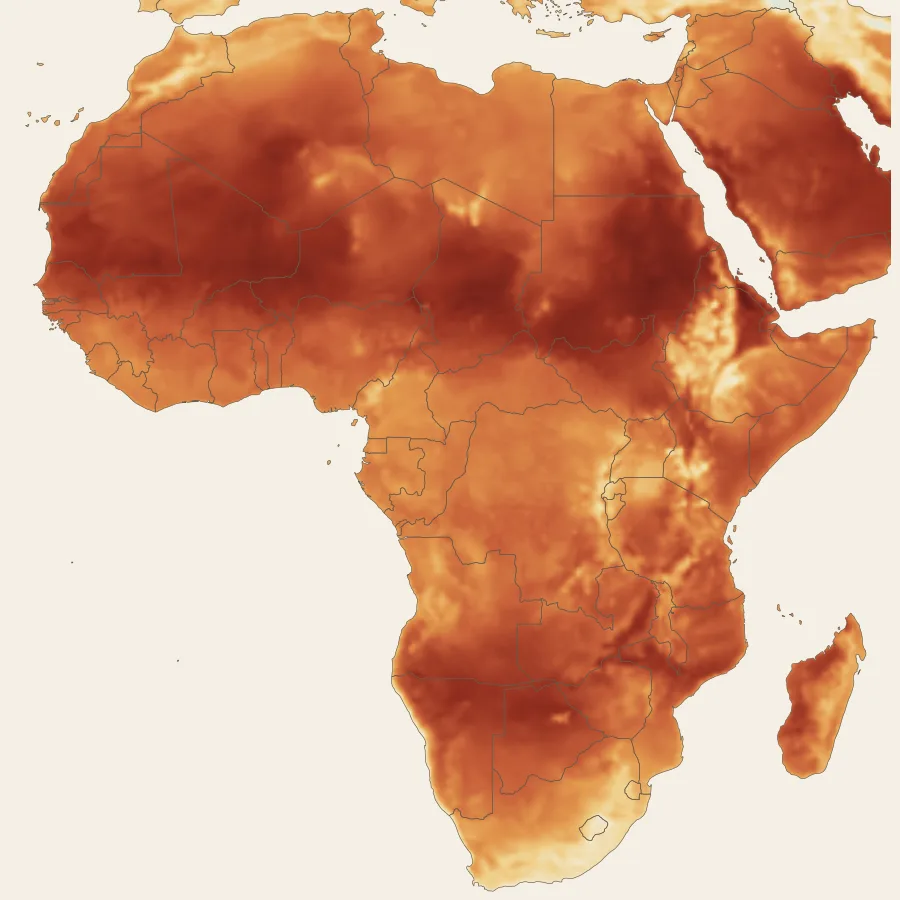
Mean air temperature, Africa
Solar and renewable energy siting

Utility scale solar site screening

Most solar sites fail on land, access or environmental constraints, not on sunshine. Screening those first saves months of option agreements and studies.

  • Exclude protected areas, wetlands, floodplains and forest from the search area
  • Rank parcels by land cover and road access, with your grid and irradiance layers beside them
  • Account for heat, which lowers panel output, in yield assumptions
Open the workspace
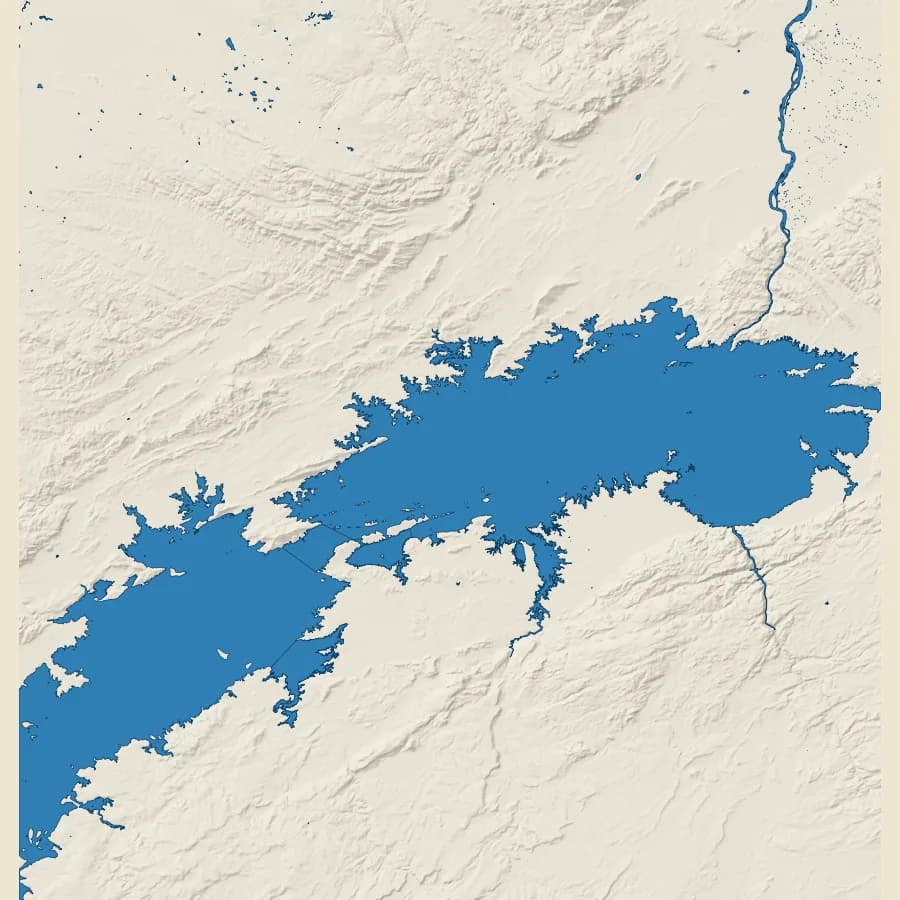
Lake Kariba and the Zambezi
Hydropower and reservoirs

Catchment and inflow risk for hydropower

Kariba showed that generation depends on rain falling hundreds of kilometres upstream. Investment and dispatch planning need the whole catchment, not only the dam site.

  • Delineate the contributing catchment of a reservoir or run of river site
  • Review rainfall and drought history across the catchment for inflow risk
  • Track upstream land cover change that affects runoff and sediment
Open the workspace
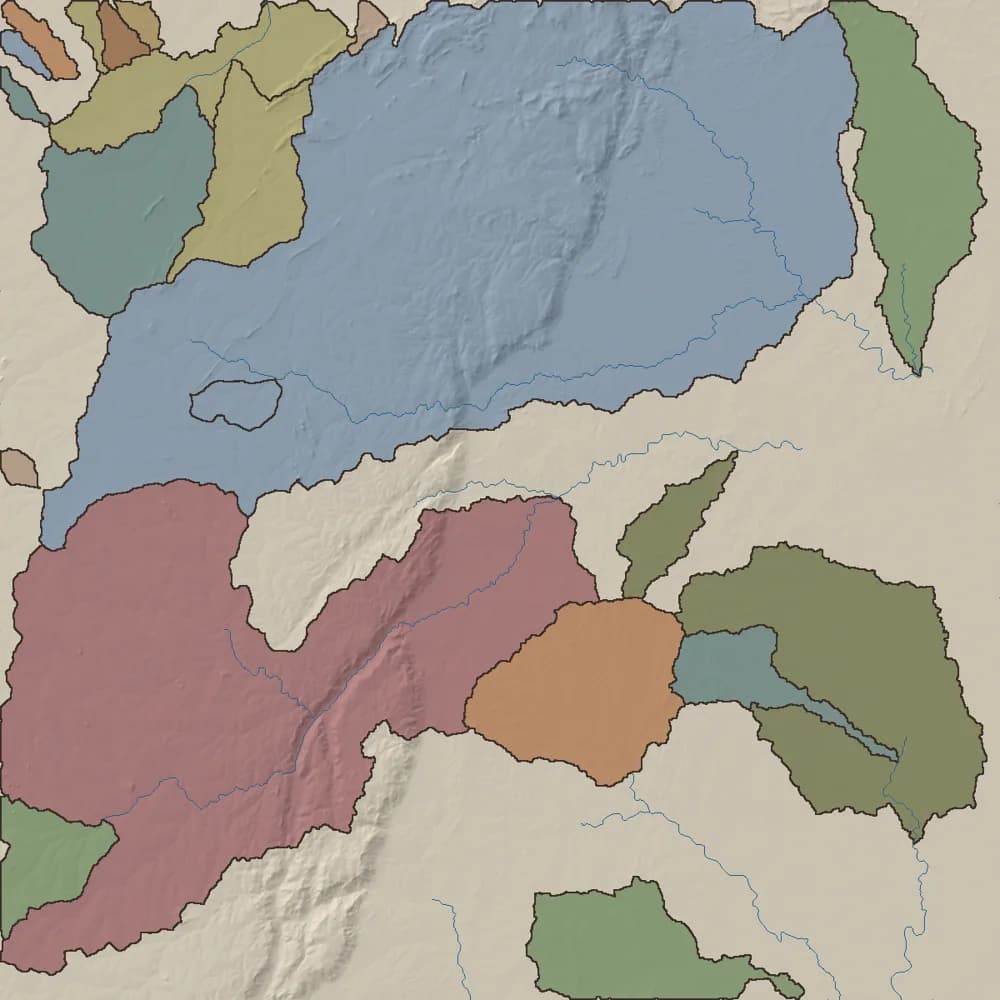
HydroBASINS watersheds
Water supply and catchments

Source protection and groundwater planning

Utilities and WASH programmes need to know where their water comes from, who shares it and what threatens it, from the catchment down to the borehole.

  • Delineate catchments upstream of surface water intakes
  • Place boreholes and schemes in their aquifer and catchment
  • Map land use pressure inside source protection zones
Open the ready-made map
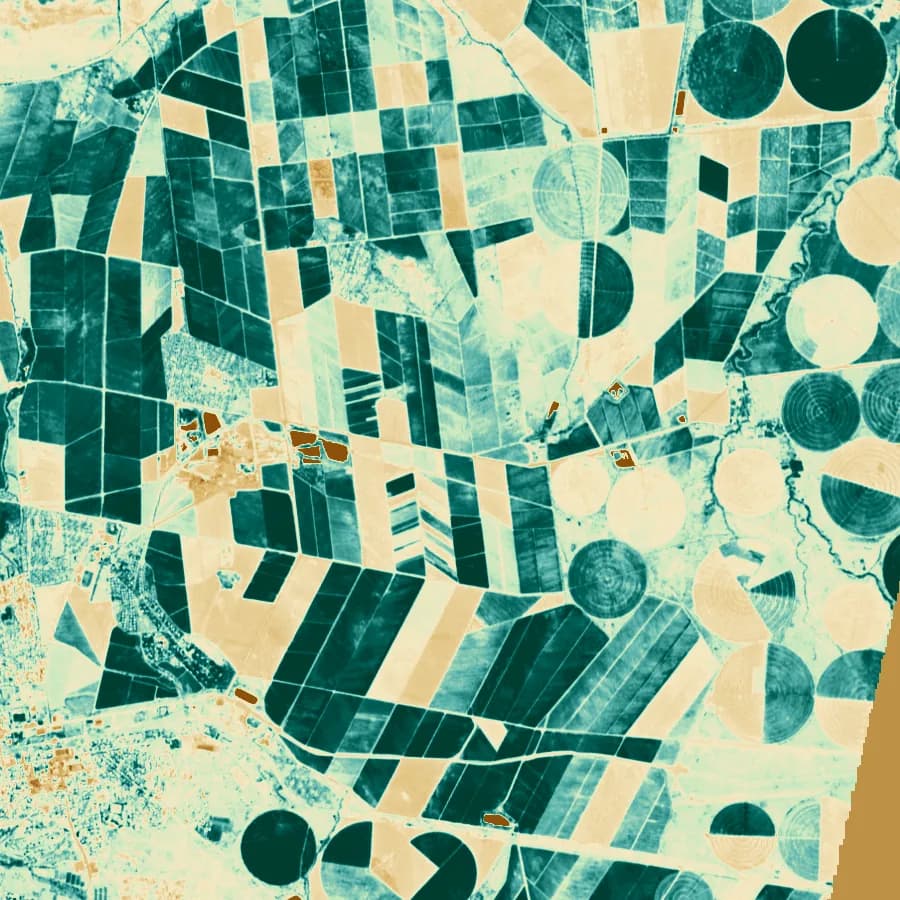
NDVI over irrigated estates
Satellite imagery and NDVI

Satellite and NDVI analysis in context

An NDVI anomaly means little until you know the land cover, the soil, the rainfall that season and whose land it is. The reference layers sit beside your scenes.

  • Interpret vegetation change against land cover and rainfall
  • Compare seasons over a site for monitoring and verification
  • Share imagery with colleagues who do not run GIS software
Open the workspace
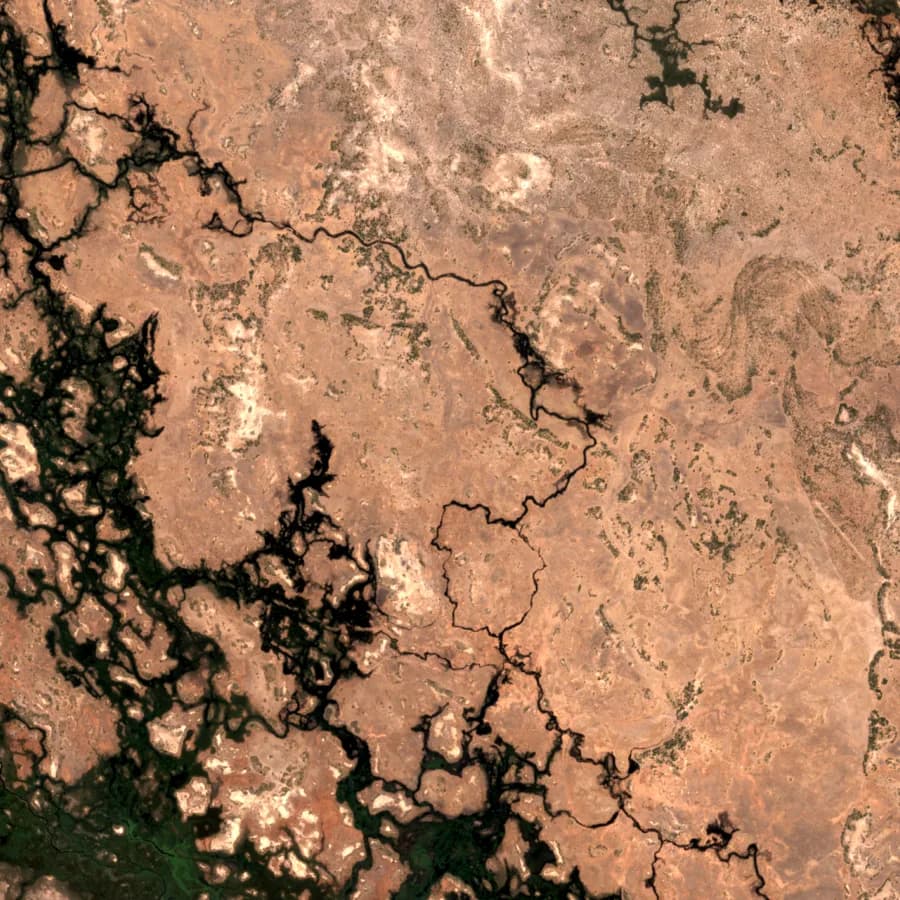
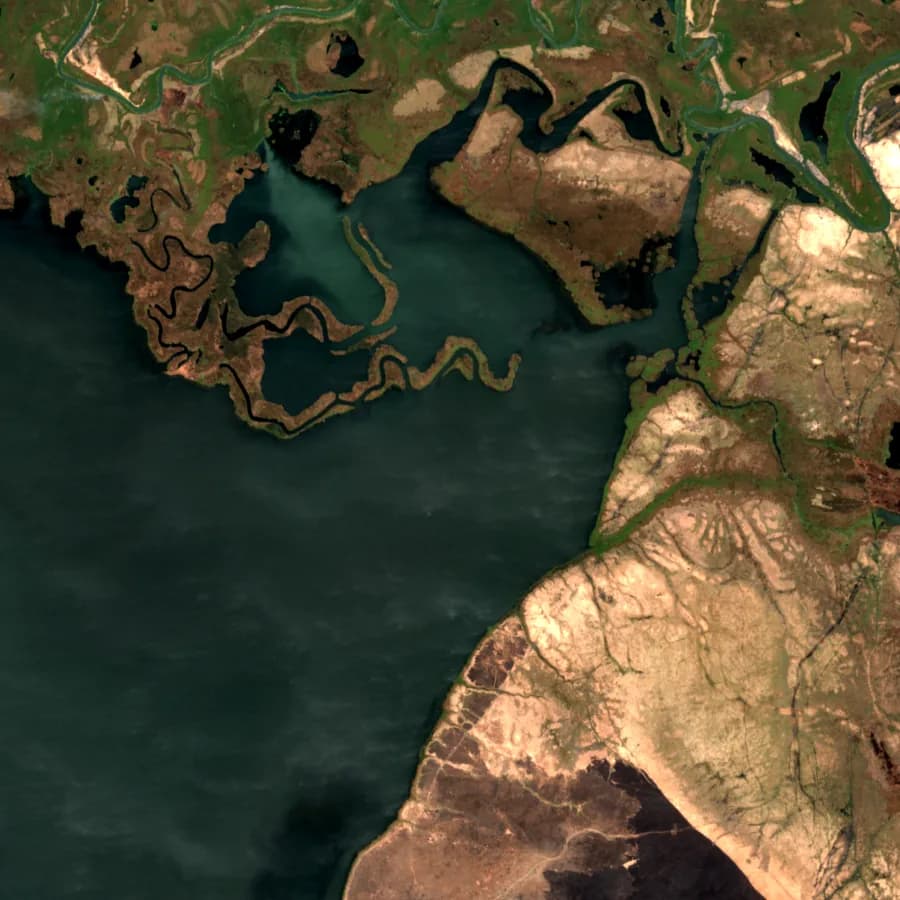
Sentinel-2, river floodplain
Floods and wetlands

Flood and wetland exposure

Settlements, roads and farms move into floodplains and wetlands faster than planning records show.

  • Map people and assets inside floodplain and wetland extents
  • Flag designs that cross wetlands while they can still change
  • Support drainage and resettlement planning with the rainfall record
Open the workspace
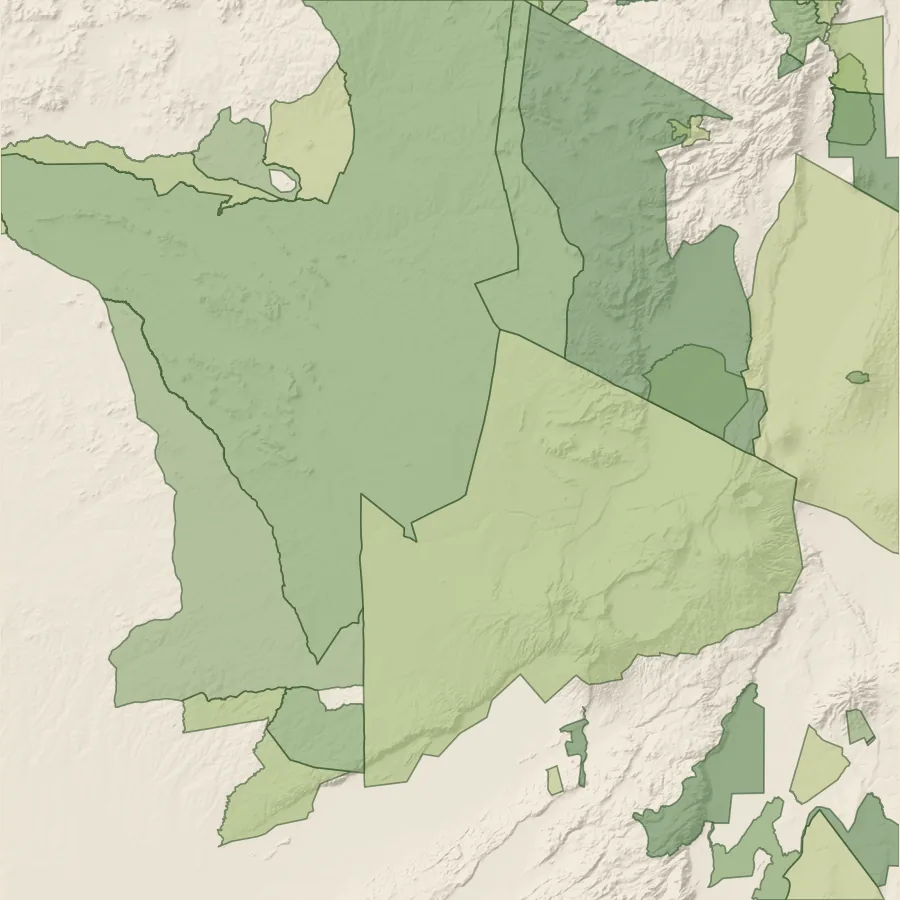
Protected areas (WDPA)
Biodiversity and nature disclosure

Biodiversity screening and nature disclosure

IFC Performance Standard 6 and TNFD both start with location: which operations sit in or near sensitive ecosystems.

  • Screen sites against protected areas, wetlands and intact land cover
  • Measure pressure at protected area edges from roads and settlements
  • Support the Locate phase of a TNFD LEAP assessment
Open the workspace
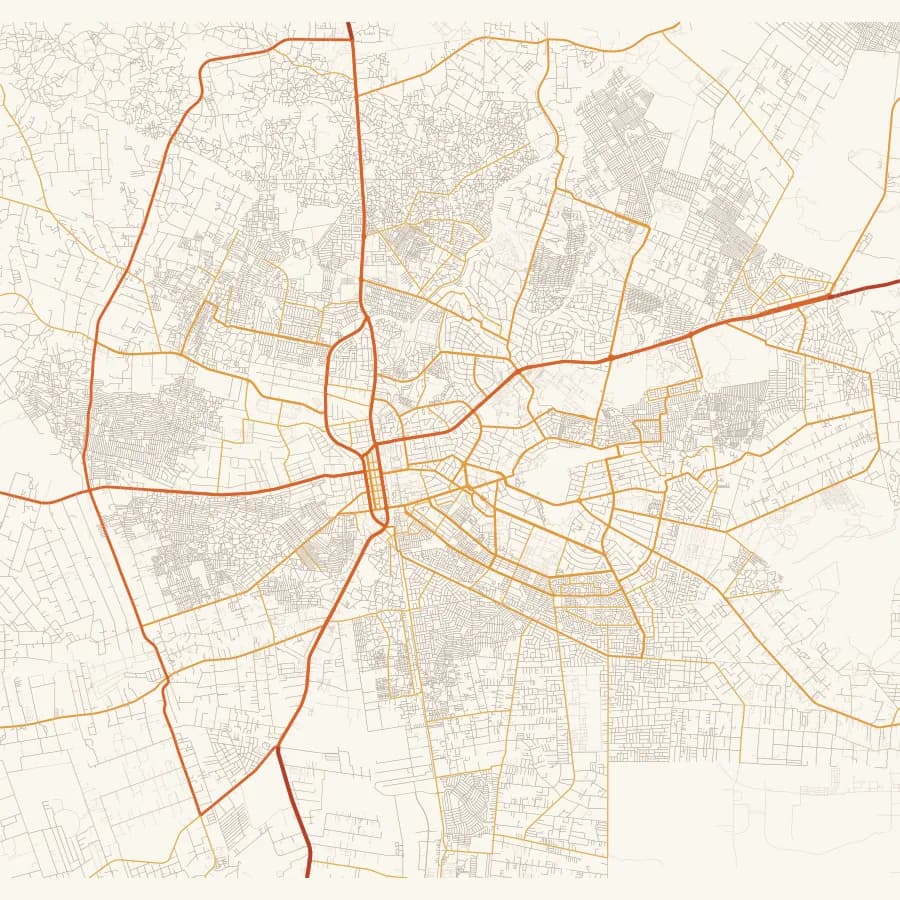
Road network (Overture)
Roads and infrastructure corridors

Corridor and route option analysis

Route selection trades cost against crossings, communities and protected land. All of it can be compared on one map, with the reasoning recorded.

  • Count river crossings and wetland sections on each option
  • Estimate affected settlements for land take and resettlement planning
  • Record the alignment decision and its comments in the project history
Open the ready-made map
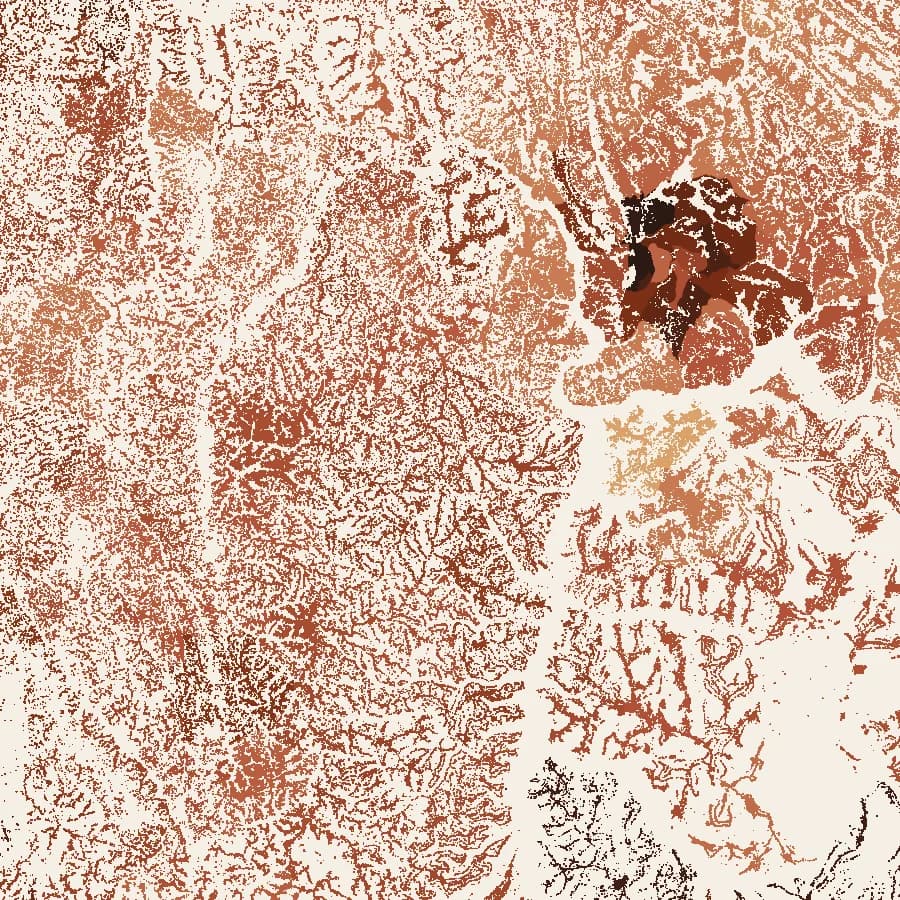
Settlement density (HRSL)
Humanitarian and WASH planning

Population exposure for response and WASH

Response, WASH and health planning need people, not polygons. Settlement layers under the hazard map turn an affected area into a number of people.

  • Estimate people in drought or flood affected areas by district
  • Plan water points and services against settlement distribution
  • Share one operational map across agencies and partners
Open the workspace
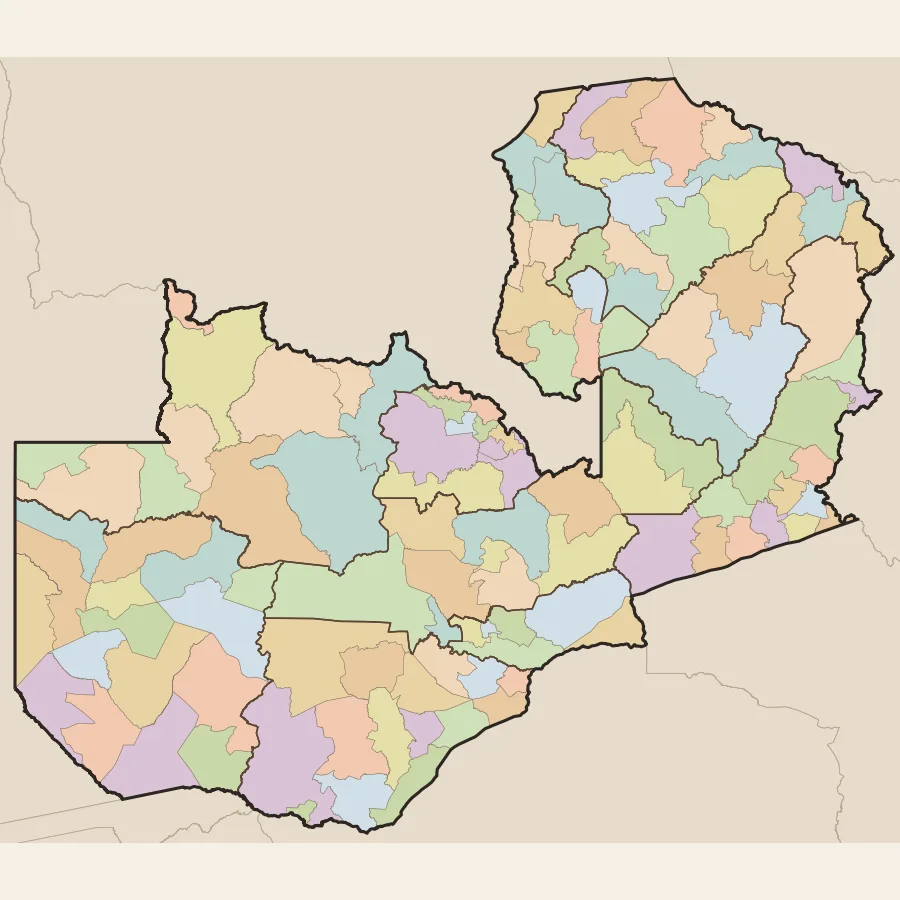
Administrative boundaries (geoBoundaries)
Data pipelines, AI and automation

Reference data for models, pipelines and AI agents

Models and automated workflows fail quietly when inputs differ from country to country. The Lenga API returns the same documented layers, in the same structure, for every country covered.

  • Pull boundaries, climate and hydrology into scheduled jobs with an API key
  • Feed district statistics to forecasting and risk models
  • Ground AI agents and report generators in sourced spatial data
Open the workspace
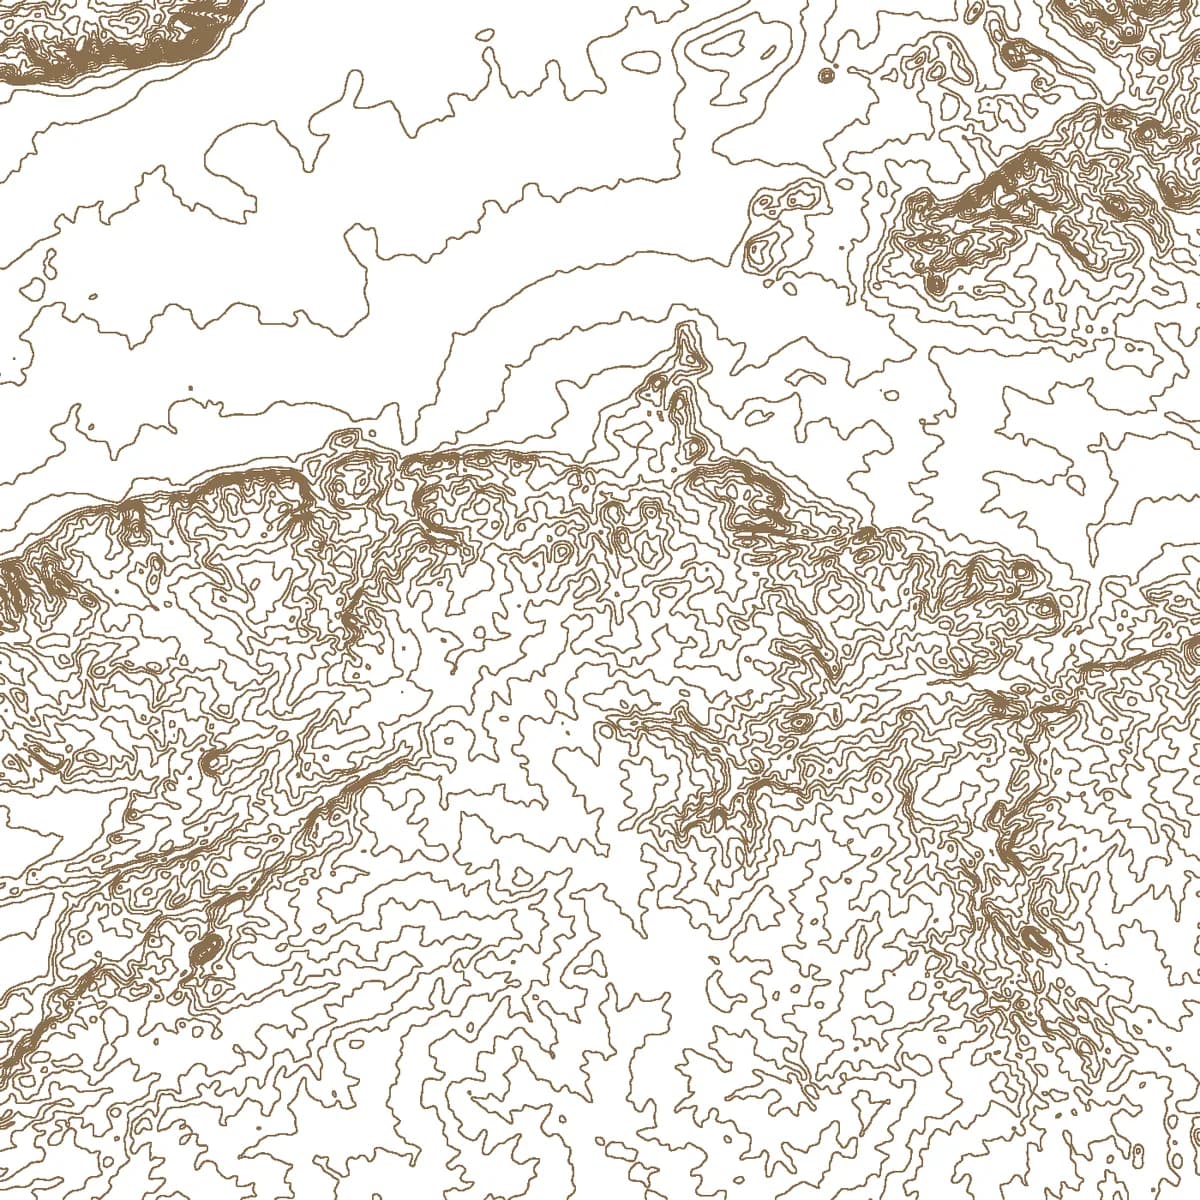
Contours from a DEM
Drone and field surveys

Drone and field data in national context

A survey is most useful when the whole team sees it against the wider landscape. Orthomosaics, elevation models and field points sit beside the national layers.

  • Check survey results against land cover, rivers and boundaries
  • Pin comments and voice notes to exact locations for the field team
  • Keep each flight in the project history for comparison
Open the workspace

Confidentiality

Files, boundaries and imagery your team uploads stay in your team's private folder. They are used only to show your project to the people you invite. They are never shared, sold or published, and never mixed into the Lenga database. An NDA is available on request, and we delete your data whenever you ask.

Your job is not here?

We also join projects as the GIS partner and build custom mapping tools.